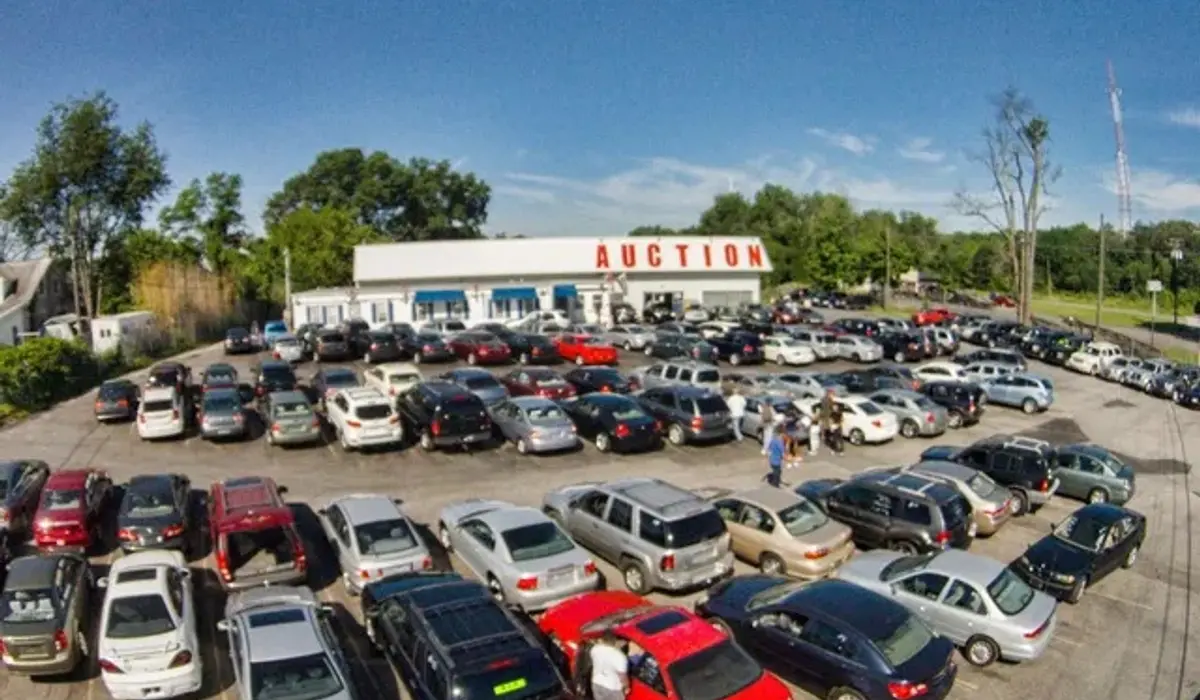
How a small daily crawler pointed at New Zealand's insurance auctions grew into a three-year, 660,000-record public dataset.
During time in New Zealand, buying and selling cars became a practical side hustle: picking up damaged cars from insurance auctions, fixing them, and selling them on. The Garage is basically the receipts. This series is the story of the tooling that grew around that habit:
- Part 1 (this post): getting the data: a daily crawler and three years of logging
- Part 2: running analytics on it, the dashboard and the free API
- Part 3: predicting prices with XGBoost, the model and the Streamlit app
Everything below is open source and lives at findcars.prasanthsasikumar.com.
Why scrape auctions at all?
The main source was manheim.co.nz. Manheim New Zealand runs the damaged-vehicle auctions where insurance write-offs end up. After moving to Singapore, friends still asked "is this a good buy?", and answering meant checking listings constantly across a timezone gap. Intuition doesn't scale; a crawler does.
A crawler with a cron job
The first version was deliberately boring: a Python script (requests + BeautifulSoup) that pulls the day's damaged-vehicle inventory and writes one CSV per day.
The interesting decision was where to run it. There's no server anywhere in this project: the scraper runs as a GitHub Actions cron job, and the repository itself is the database. Every morning the action scrapes the day's listings and commits car_data_YYYY-MM-DD.csv to data/raw/. Git history doubles as an audit log: if a day's data ever looks weird, the diff shows exactly what was captured.
Each row logs what a buyer would actually want to compare:
- Vehicle: manufacturer, model, year, odometer, fuel type, transmission, seats
- Condition: the damage description ("Left Front Damage, Selling Registered"), registration status
- Auction context: date, current price, and a link back to the listing
One field worth calling out: year wasn't in the listing table itself, but it was encoded in each listing's URL. A small parser (and a backfill script over every historical CSV) recovered it for the full dataset, which matters a lot later, in the prediction post.
Three years later
The habit compounded quietly. As of mid-2026 the dataset covers:
- 1,131 days of scraping since May 2023, with only 8 missing days (99%+ coverage)
- 660,000+ raw records, about 460,000 after cleaning
- 500+ manufacturers (the long tail of "manufacturers" includes some very creative trailer builders)
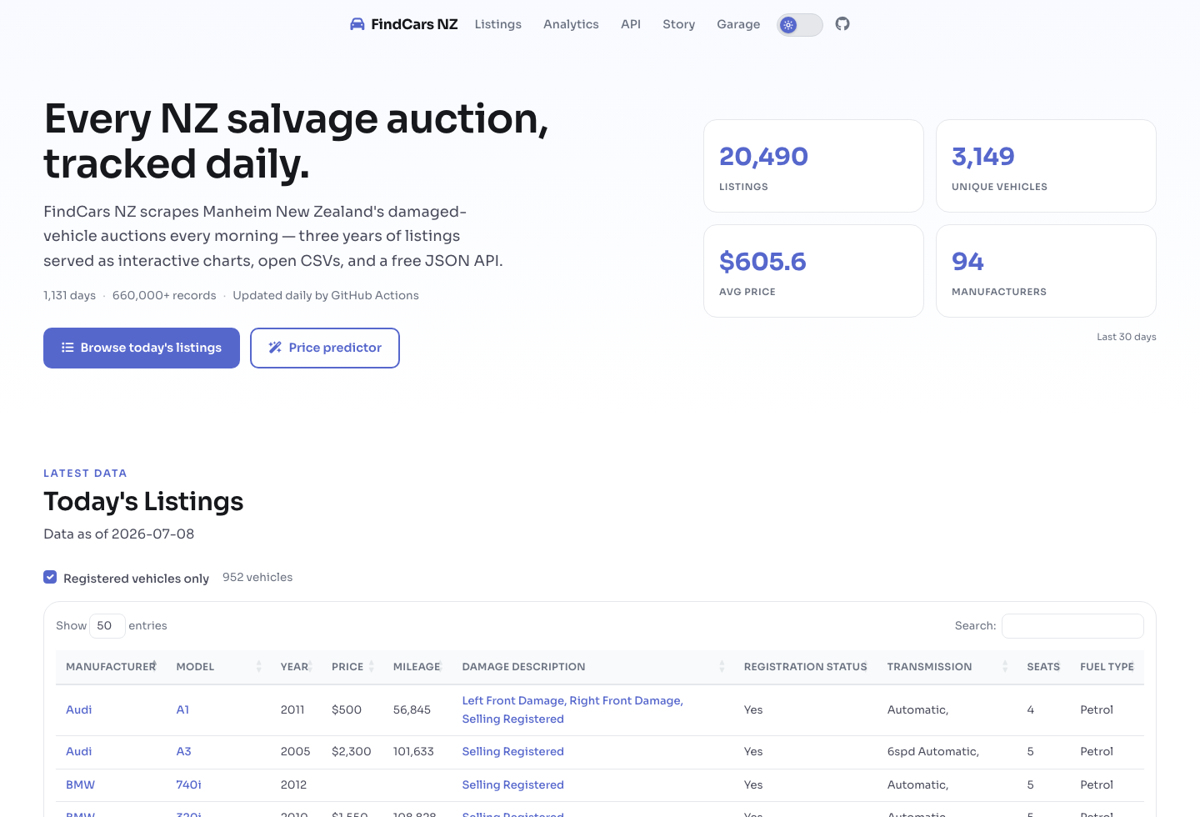
Those are the numbers on the live site right now, because the counters are read from the dataset rather than typed in.
The missing days are honest gaps: a couple of site outages and one six-day stretch in early 2024 when the scraper broke silently after a site change. That was the lesson: scrapers don't fail loudly, they fail quietly. A daily-commit setup helps here too, because a missing commit is visible.
Cleaning: where the real work is
Raw scraper output is never analysis-ready. The cleaning pipeline (clean_data.py) does the unglamorous parts:
- Deduplicates relisted vehicles (the same car often appears across many days)
- Normalises prices and odometer readings
- Standardises manufacturer and model names ("Mercedes-Benz" vs "MERCEDES BENZ" vs "Benz")
- Adds derived features like vehicle age
- Exports to CSV, Parquet, and SQLite
The consistent lesson from living with this pipeline: logging consistently mattered more than any clever processing. Every fancy thing in parts 2 and 3 only works because the boring daily CSV kept landing.
The data is public
All of it (raw daily CSVs, the cleaned dataset, and the precomputed API snapshots) is MIT-licensed on GitHub:
- Raw daily CSVs (1,131+ files)
- Processed dataset (CSV / Parquet / SQLite)
- Full repository
If you use it for something interesting (research, a dashboard, a better model), I'd genuinely like to hear about it.
Next up: Part 2: what 1,100 days of salvage auctions reveal, and how the dashboard serves a JSON API with zero servers.
NZCarAuctions: NZ Car Auctions, Part 2: Analytics With Zero Servers