What 1,100 days of NZ salvage auctions reveal, and how FindCars NZ serves interactive charts and a free JSON API from a purely static site.
Part 1 covered how a daily crawler built a 660,000-record dataset of New Zealand insurance-auction listings. This post is about making it useful: the analytics dashboard at findcars.prasanthsasikumar.com, what the data actually says, and the architecture trick that keeps the whole thing free to run.
The dashboard
FindCars NZ is a single page with four jobs:
- Today's listings: the current day's inventory as a searchable, filterable table (with a "registered vehicles only" toggle, because unregistered write-offs are a different game)
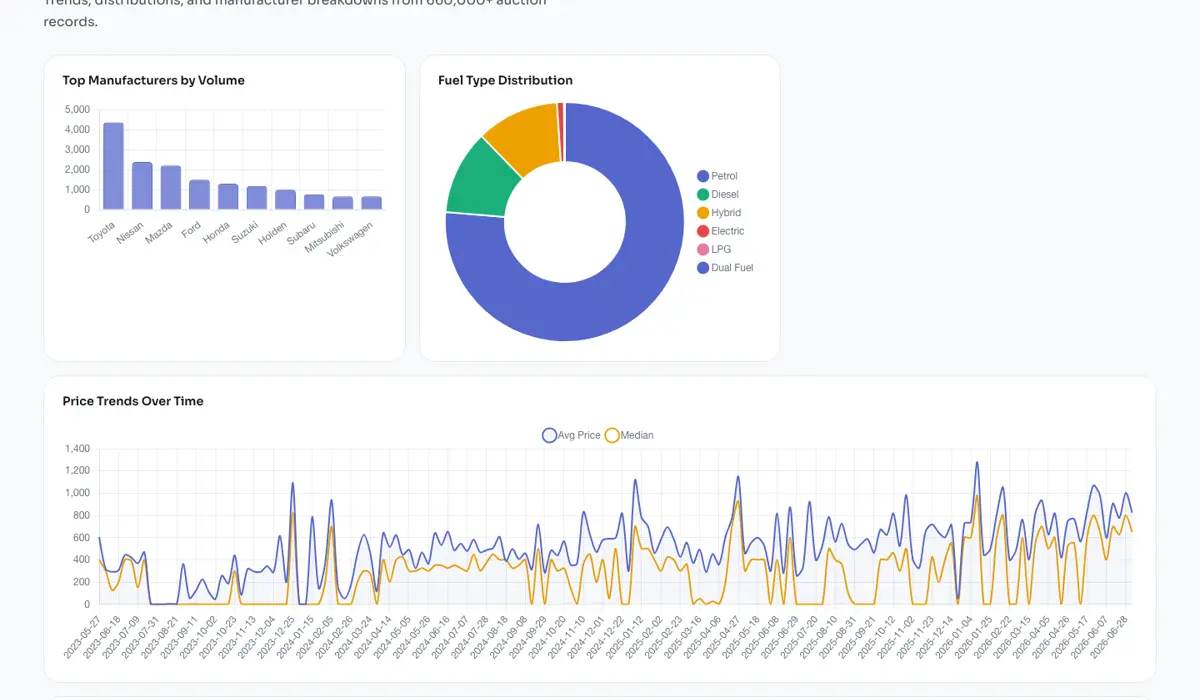
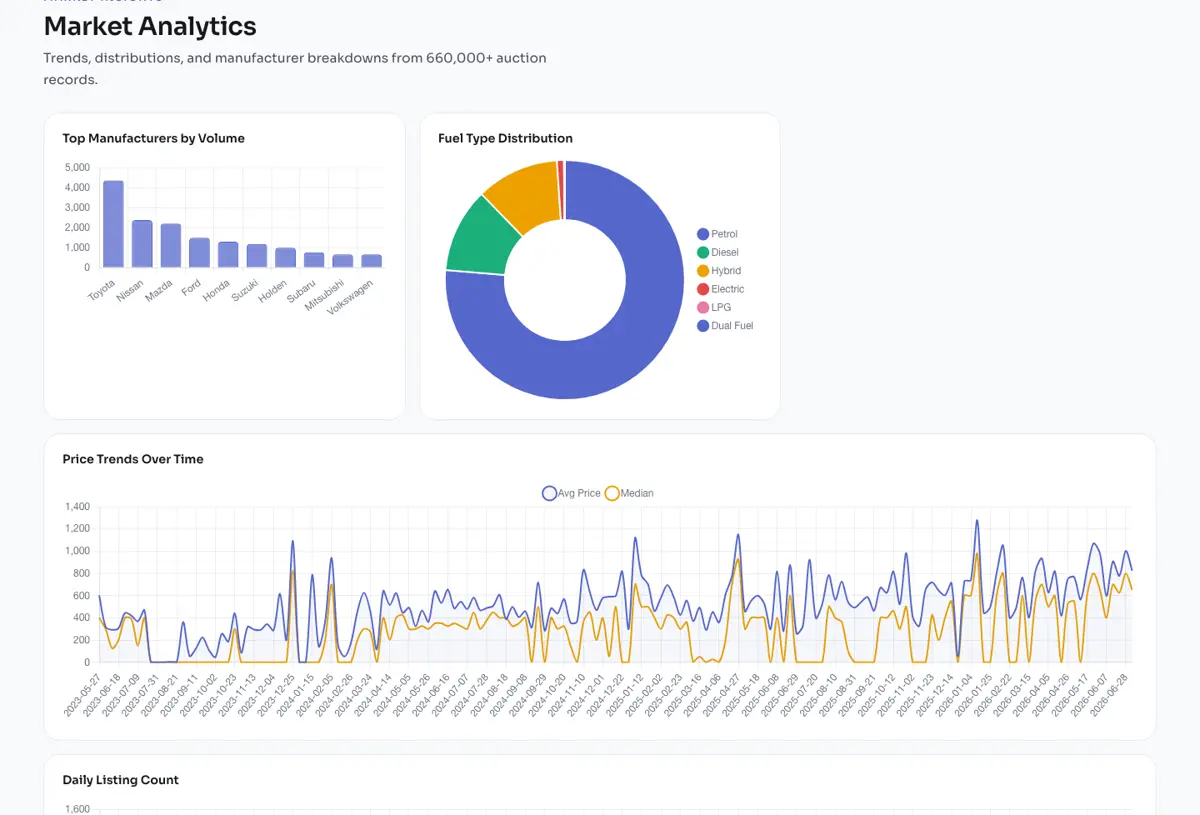
- Market analytics: price trends, manufacturer breakdowns, damage types, and price distributions across the full history
- A free REST API: for anyone who wants the numbers without the UI
- Open data downloads: the raw and cleaned datasets from Part 1
An API with no server
The architecture is the part I enjoy most. There is no backend; the site is static files on Netlify. The "API" works like this:
- The daily GitHub Action doesn't just scrape; it precomputes JSON snapshots (30-day overview stats, price trends, manufacturer aggregates, damage keyword counts, price brackets) into
data/api/. - Netlify redirect rules map friendly routes like
/api/v1/stats/overviewonto those static JSON files, with CORS open and hourly cache headers.
So this works, for free, forever, with nothing to maintain:
import requests
r = requests.get("https://findcars.prasanthsasikumar.com/api/v1/stats/overview")
print(f"Average price: ${r.json()['avg_price']}")
The trade-off is honest: the API only answers precomputed questions. But for a dataset that changes once a day, computing answers once a day is exactly the right amount of compute.
What the data says
A few things that surprised me, or confirmed suspicions with numbers:
Salvage is cheap. The average listing price hovers around $500–600, and the median is lower still. The price distribution is brutally skewed: the biggest bracket by far is $0–$500. These are insurance write-offs: the value is in what they can become, not what they are.
Toyota is a fifth of the market. Roughly 96,000 of the 460,000 cleaned records are Toyotas, with Mazda, Nissan, and Honda following. No surprises for anyone who's parked in New Zealand, but it matters for modelling: common cars have good comparables, rare ones don't.
Petrol still dominates, but hybrids are visible. About three-quarters of current listings are petrol; hybrids now show up in meaningful numbers, and EVs are a small but persistent trickle.
Front damage is the modal accident. Damage-description keyword counts put front damage clearly on top, which fits the mundane reality of how cars get written off: nose-to-tail traffic.
Volume has structure. Daily listing counts breathe with the calendar (quiet over the holidays, busy in bursts), and the three-year trend lines make market shifts visible in a way no amount of daily browsing did.
Design notes
The 2026 refresh brought the dashboard in line with the visual language I use across projects (Sora type, an indigo primary, card-based sections), plus a proper light/dark theme with chart palettes validated separately per mode (dark mode is its own palette tuned for a black surface, not an automatic inversion).
Next up: Part 3: predicting auction prices with XGBoost, where the logged history becomes an "is this a good buy?" estimator you can try live.
NZCarAuctions: NZ Car Auctions, Part 3: Predicting Prices With XGBoost